
J. Holt Schooling produced a series of articles in The Railway Magazine after the turn of the 20th century. I came across the third of these in the July 1903 edition of the magazine. [1: p20-28] Elsewhere in the same magazine, there was a short note which highlighted the total net receipts of all Britain’s railways companies with the figures tabulated. [9: p59]
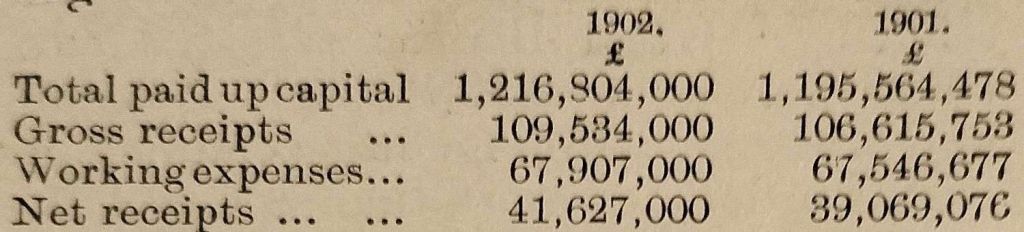
The figures show a small but significant increase between 1901 and 1902.
Holt Schooling’s article looked at some detailed statistics relating to British railways, with some comparisons made with statistics relating to the railways of the USA. …
Accidents
Holt Schooling highlighted the decrease in the chance of death or injury to railway passengers over the period from 1877 to 1901. Accidental deaths fluctuated over the period, injuries fell significantly in absolute terms (4,330 injured between 1877 and 1881 and 2,988 in 1897 to 1901) during the same period, the number of passengers carried rose significantly (2.9 billion to 5.5 billion). In relative terms, the number of deaths and injuries improved dramatically. The proportion killed, reducing from 1 in 17.9 million to 1 in 75.6 million, and the proportion injured refusing from 1 in 700 thousand to 1 in 1.2 million.
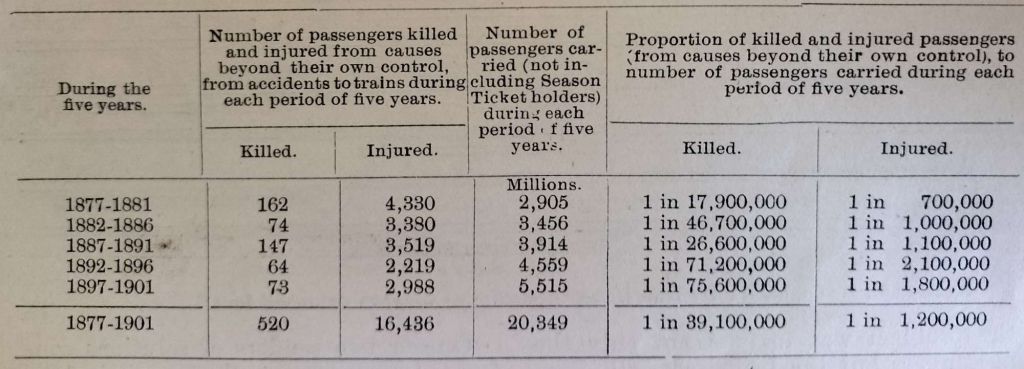
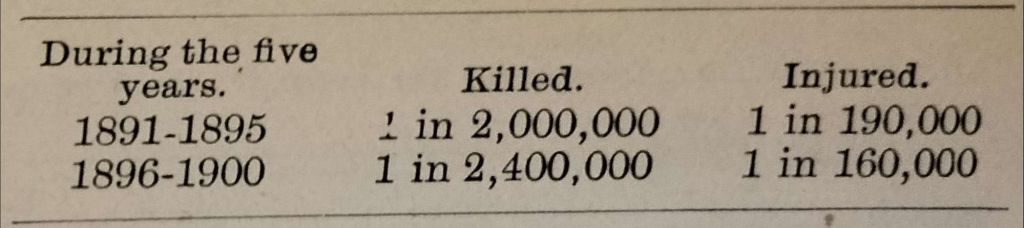
Comparable figures in the USA show that the chance of death or injury while travelling by rail in the USA is very much higher, close to eight times higher.
Holt Schooling notes that “This result, unfavourable to the United States, is partly qualified by the fact that American railway journeys are of greater duration than English railway journeys, American passengers thus being exposed to risk of accident for a longer time than the British pas- senger, and also the American returns do not explicitly state whether or not the accidents to passengers are ‘from causes beyond their own control’ – a condition that applies to the foregoing accident facts for British railways.” [1: p21]
Holt Schooling produced a 10 year summary of the causes of accidents. …
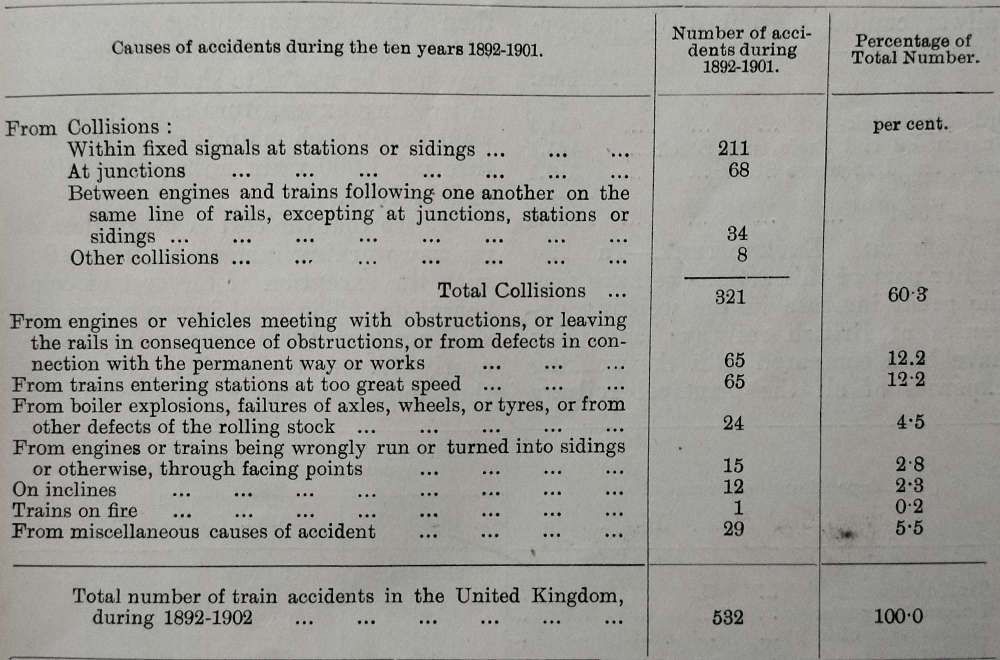
He notes that, “collisions account[ed] for 60% of all train accidents that happened, and that only two other causes of accidents had any material degree of frequency.” [1: p21] These were defects in the permanent way and trains entering stations at too great a speed.
Rates of Dividend on Ordinary Stock
In 1901, over £454 million was invested in railway companies ordinary stock. Schooling focuses on Ordinary Stock because it is the largest of the stocks under which railway capital is grouped. He explains that Guaranteed and Preference Stock amounted to more than £425 million, and Loans and Debenture Stock, just over £316 million.
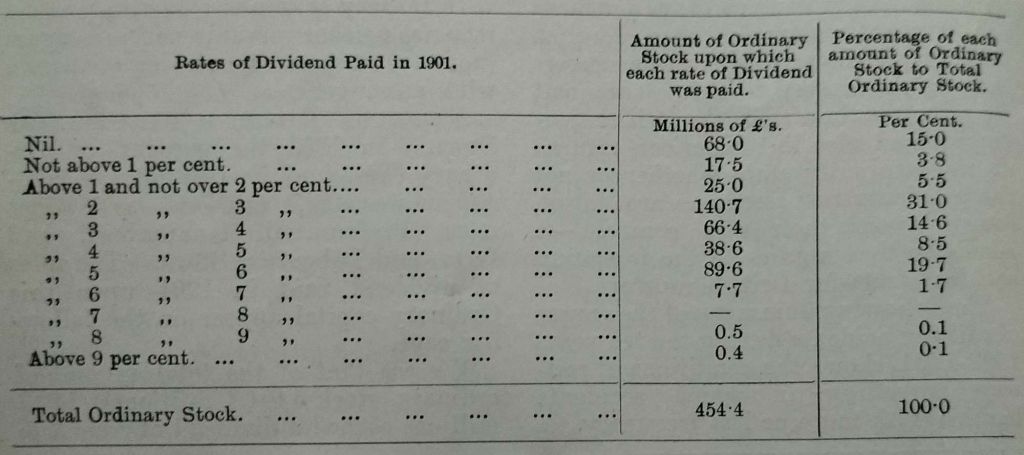
31% of Ordinary Stock paid a dividend between 2 and 3%. Interestingly, nearly 20% of the stock paid a dividend from 5 to 6%. [1: p22]
Working Expenditure
Railway costs per 1000 train-miles all rose between 1900 and 1901, with the exception of the cost of compensation which marginally decreased.

In absolute terms, the pattern is similar. Railway costs rose by just over £2.7 million between 1900 and 1901.
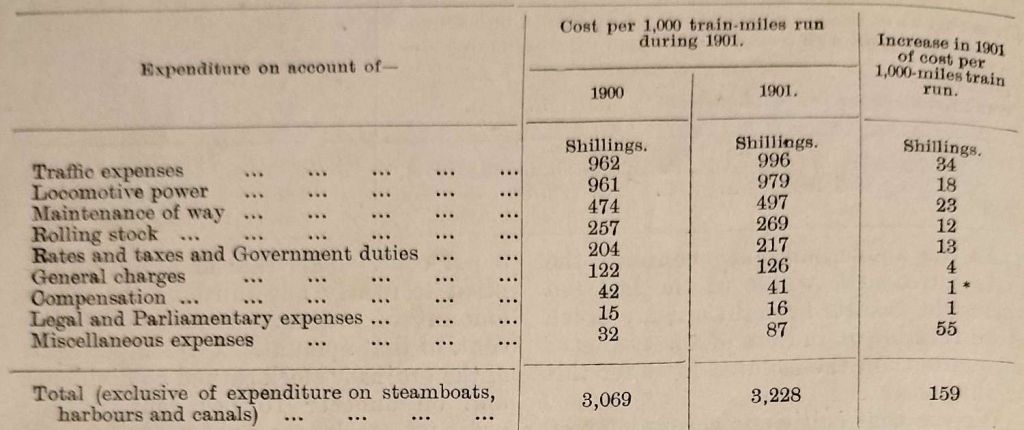
That increase in costs was only partially matched by a £1.5 million increase in gross receipts.
Train Mileage
Holt Schooling compared British and American figures for the year 1900 which was the latest year he had figures for. …
USA passenger train miles were 363.5 million, goods train miles were 492.6 million. A total of 856.1 million miles. The figures for the UK were respectively, 220 million, 180 million and a total of 400 million miles.
It is worth noting that freight mileage in the USA was considerably higher than passenger mileage. In the UK passenger mileage exceeded freight mileage. Train mileage in total in the USA was more than double that in the UK.
It is interesting, however, to consider the intensity of use of lines in the USA and the UK. This provides a very different picture. …
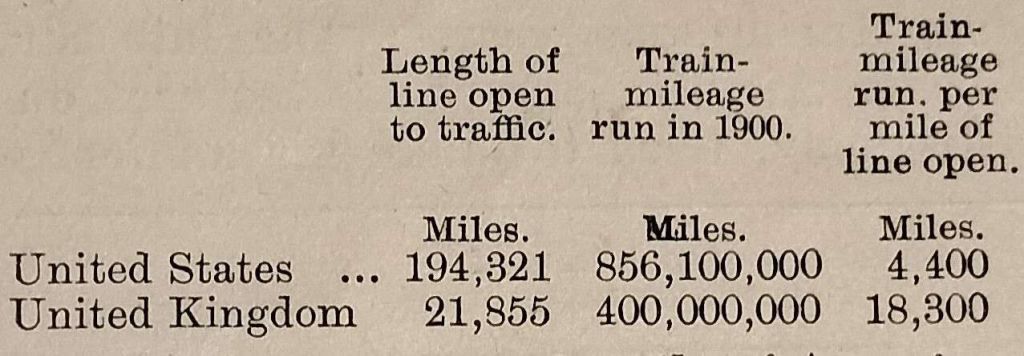
Holt Schooling comments that on “average, each mile of American railroad is passed over by a train 4,400 times in the year, or twelve times per day. But each mile of British railroad is passed over by a train 18,300 times in the year, or fifty times per day. This is a striking fact, and it is another of those fundamental differences between the railway systems of the two countries … Our railways are used more than four times as often as the American lines are used, and this fact necessarily carries with it many other important differences between the two railway systems and the methods by which they are worked.” [1: p24]
Classes of Passengers
Three different classes were used on Britain’s railways. Holt Schooling tabulates the figures for each class in 1901.
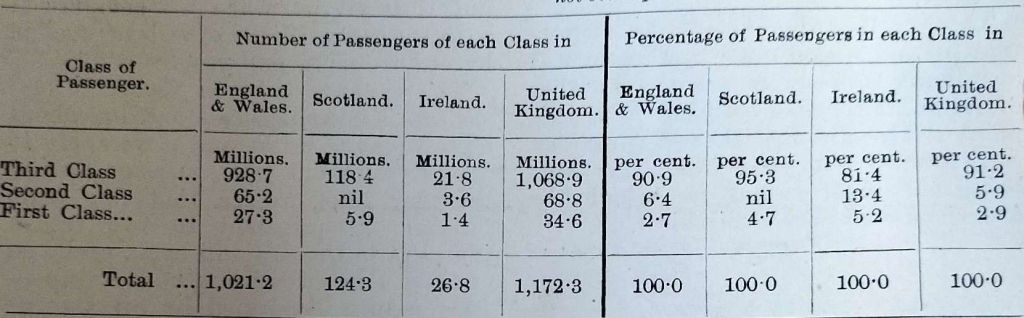
Holt Schooling notes “the overwhelming preponderance of the third-class passenger … 91.2 per hundred. The [highest] proportion of third-class passengers [was] in Scotland; and the lowest proportion of third class passengers [was] in Ireland, 81.4 per 100.” [1: p24-25] It is worth reminding ourselves that the whole of Ireland, at this time, was still considered to be part of the UK.
Holt Schooling goes on to note that the highest proportion of second- and first-class passengers in the UK was in Ireland and then comments that these figures suggest that Irish travellers do not feel the need for thrift in the way others in the UK do. He seems to suggest that his figures show that Ireland was not as poverty-stricken as was currently being made out in 1903.
It seems to me that this is only one way of interpreting the figures. Surely it is, at least, just as possible that these figures suggest that relative poverty was greater in Ireland given that a lower proportion of people were able to afford to travel third-class. It is also possible to infer from the figures that there was a greater disparity between rich and poor in Ireland than in the rest of the UK.
Receipts from Passenger and Goods Traffic
Gross receipts of British railway companies in 1901 were £106.5 million of which over £99.5 million were traffic receipts (passenger and goods combined). Holt Schooling notes that “Goods Traffic yielded more than one-half of this amount namely, £53 million, and passenger traffic, £46.5 million.” [1: p25-26] He goes on to state that over the 10 years (1892-1901), passengers receipts had increased in relation to goods receipts as shown in the table below.
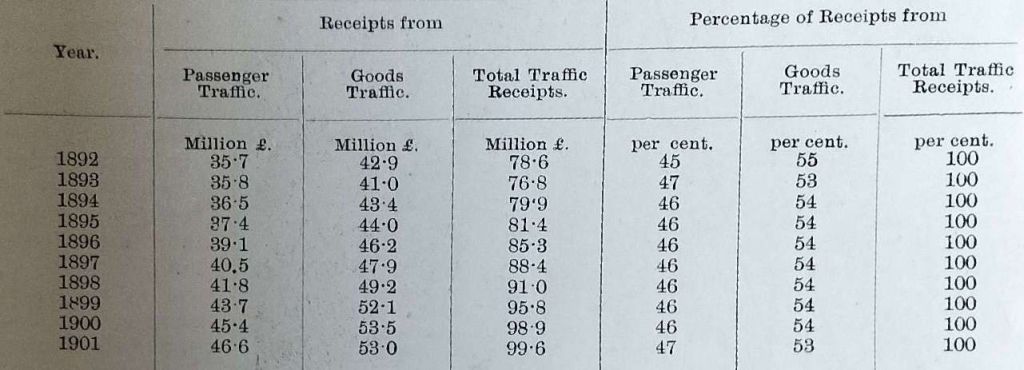
Overall receipts had increased year on year from £78.6 million in 1892 to £99.6 million in 1901. Despite the slight discrepancy in figures between Holt Schooling’s narrative and the table above, it is clear that the relative proportion of income changed over the 10 year period from 45% passenger/55% goods, to 47% passenger/43% goods.
Holt Schooling looks behind these overall figures and notes that close to 77% of passenger receipts came from third-class passengers! The figures were: 76.8% third-class; 10.7% second-class; 12.5% first-class.
Comparison of some Individual Railway Companies
Holt Schooling provides some details of individual railway company receipts/expenditure in 1901. [1: p26]
The lowest percentage of expenditure to receipts that he quotes is for the Furness Railway, 51%, closely followed by the Great North of Scotland Railway (52%), the North British Railway (53%), the Caledonian Railway (56%), the Great Northern Railway of Ireland (56%), the Taff Vale Railway (58%), Midland Great Western Railway of Ireland (59%) and the Glasgow and South Western Railway (61%).
The average of all British railways was 63%, a figure which also applied to the GWR, the L&Y and the LNWR. Those with higher percentage of expenditure included: the Great Southern & Western Railway of Ireland, the London & South Western Railway and the Midland Railway (64%), the North Eastern Railway (65%), the Great Eastern Railway (66%), the Great Northern Railway (67%) and the Great Central Railway (70%)
Holt Schooling suggests that these figures are counterintuitive. Rather than the larger companies being the most efficient, it seems that it was the smaller companies for whom this was true. There also appears to be a Northwest/Southeast divide with the least efficient companies being to the South and East of the country, while the more efficient were in the North and West, including Ireland!)
Holt Schooling also looks at receipts per train mile in pence/mile. …
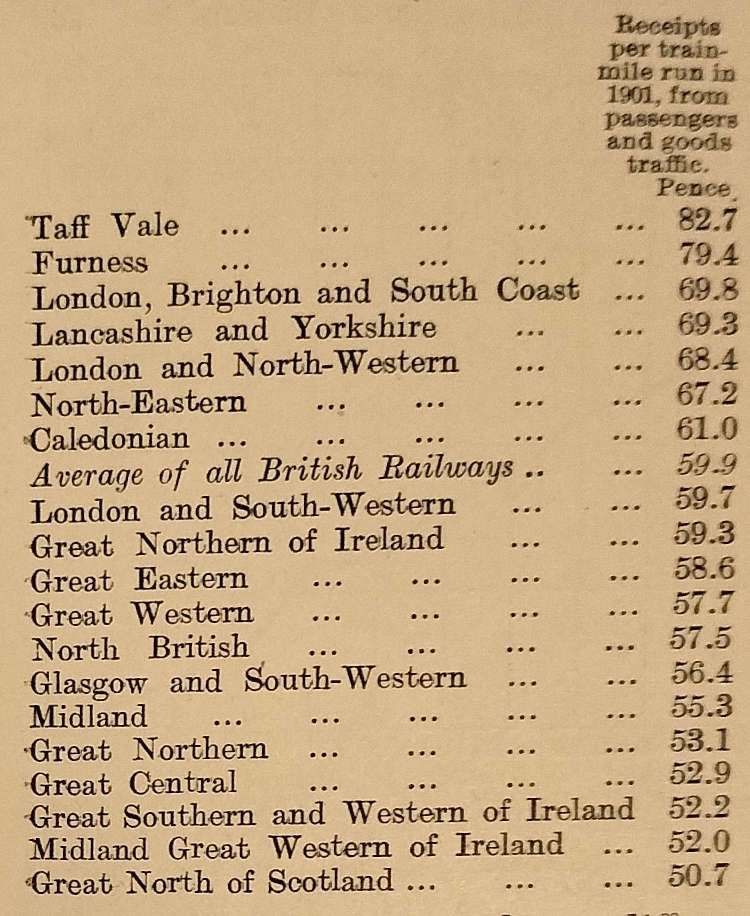
Holt Schooling comments: “Here, again, are very large differences. The Taff Vale Railway received nearly 7s. per train-mile run from passenger and goods traffic, while the Great North of Scotland Railway received little more than 4s., the mean result for all railways in the United Kingdom being almost exactly 5s. per train-mile run. There are many important railways in the above list whose receipts per train-mile run are appreciably below the average, although upon general considerations, one would expect them to be above rather than below the average.” [1: p27]
Delayed Arrival of Trains
The most recent figures available to Holt Schooling, issues by the Board of Trade, related to some companies’ long-distance train arrivals in London in the 3 month period, June-August 1895. …
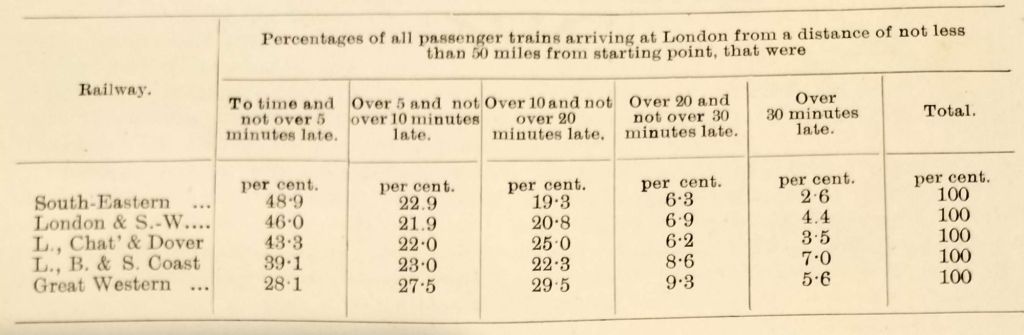
Figures for trains originating more than 50 miles from London may well feel comparable for the first four companies in the table above. Given the greater distances travelled by trains in the GWR, it is to be expected that a smaller percentage would have arrived within 5 minutes of the scheduled time than other companies in the list.
Rail Usage, January to March 2024 and earlier.
How do the statistics from 1903 compare with modern figures? The Office of Rail and Road produces quarterly statistics about rail usage. At the time of writing, the latest statistics cover the period from January to March 2024. [2]
The ORR report is dated 13th June 2024.
“A total of 1,610 million journeys (1.61 billion) were made by rail passengers in Great Britain in the latest year (1 April 2023 to 31 March 2024). This is a 16% increase on the 1,380 million journeys (1.38 billion) in the previous year (1 April 2022 to 31 March 2023). There were 405 million journeys in the latest quarter (1 January to 31 March 2024). This is a 13% increase on the 359 million journeys made in the same quarter in the previous year (1 January to 31 March 2023).” [2]
“Total passenger revenue was £10.3 billion in the latest year. This is a 13% increase on the £9.1 billion in the previous year (when adjusted for inflation). In the latest quarter, total passenger revenue in Great Britain was £2.6 billion. This is 13% more than the £2.3 billion generated in the same quarter in the previous year (when adjusted for inflation).” [2]
Included within the ORR report was a graph showing passenger numbers since 1946.
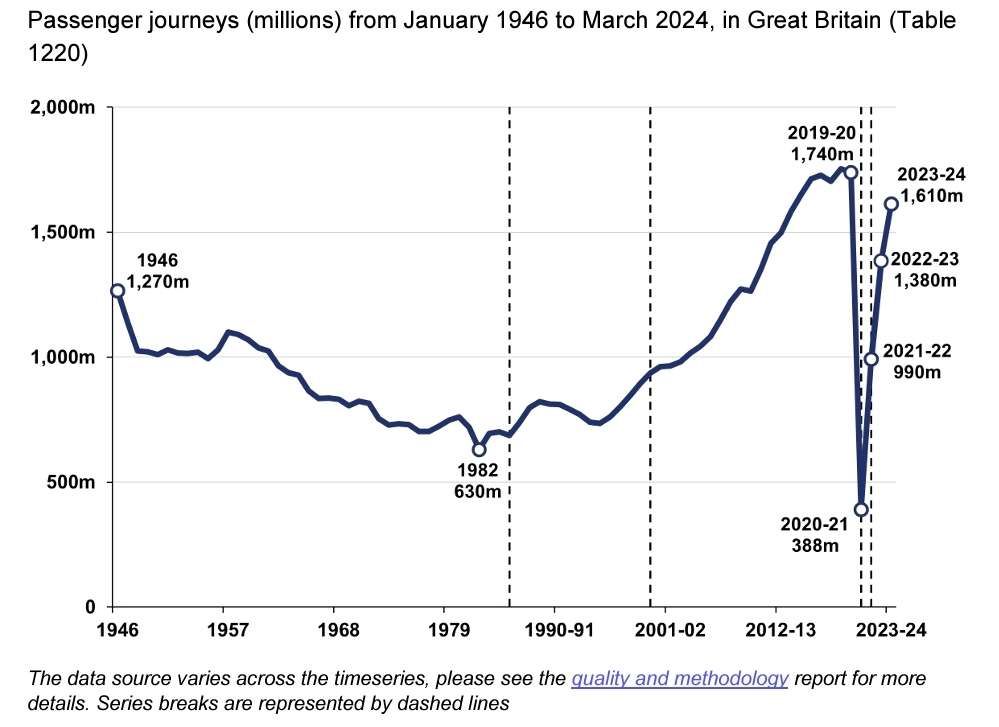
In 1946, passenger numbers were 1,270 million. A nadir was reached in 1982, just 630 million passengers. The peak since then was reached at the end of the 2010s, 1,740 million. At the turn of the 20th century Holt Schooling reported annual passenger numbers as 1,712 million, almost the same as the figure for 2019/20. The effect of the pandemic was marked. In 2020/21, passenger numbers fell to 388 million, recovering to 990 million in 2021/22, 1,380 million in 2022/23 and 1,610 million in 2023/24.
Before 1946, figures were interrupted by the two world wars. It is possible, however, to produce a similar graph to that above covering the period prior to 1946. The ORR has done so and an extract from another of their regular reports is below.
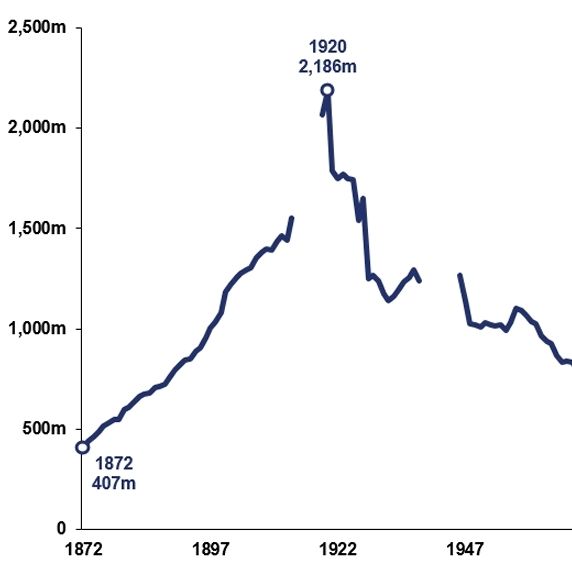
Peak patronage of the country’s railways occurred in 1920 when the railways carried 2,186 million passengers.
Passenger train kilometres: distances are recorded in kilometres in 2024. Between January and March 2024, “there were 126 million passenger train kilometres travelled, … an 8% increase on the 117 million recorded in the same quarter in the previous year. However, this is 93% relative to the 136 million in the same quarter five years previously (January to March 2019).” [2] These figures record full train movements.
Passenger vehicle kilometres: “include both the distance covered by locomotives and the carriages they transport. In the latest quarter (January to March 2024), there were 764 million passenger vehicle kilometres operated. This is a 6% increase on the 722 million kilometres in the same quarter in the previous year. However, this is still slightly below prepandemic levels, at 96% relative to the 800 million five years ago (January to March 2019).” [2]
The ORR report summary says that the key results of their statistical work are:
- A total of 1.61 billion journeys were made by rail passengers in Great Britain in the latest year (1 April 2023 to 31 March 2024). This is a 16% increase on the 1.38 billion journeys in the previous year (1 April 2022 to 31 March 2023).
- There were 405 million journeys in the latest quarter (1 January to 31 March 2024). This is a 13% increase on the 359 million journeys made in the same quarter in the previous year (1 January to 31 March 2023).
- Total passenger revenue was £10.3 billion in the latest year. This is a 13% increase on the £9.1 billion in the previous year (when adjusted for inflation).
- A total of 60.1 billion passenger kilometres were travelled in the latest year. This is a 13% increase on the 53.0 billion passenger kilometres travelled in the previous year.
Rail Accidents to 2024
Annual rail safety statistics on mainline rail, London Underground, and other non-mainline networks (trams, metros, other light rail, minor and heritage railways) are provided by the ORR, “reporting on fatalities and injuries to passengers, members of the public and workforce in Great Britain. It also covers train accidents and (annual and quarterly) number of signals passed at danger (SPADs). These incidents are reported to the Office of Rail and Road under the Reporting of Injuries, Diseases and Dangerous Occurrences Regulation (RIDDOR).” [4]
The ORR reports on rail safety at the end of September each year, at the time of writing the latest report was published on 28th September 2023. [5]
“There were eight non-workforce fatalities (passenger or public) in the latest year (April 2022 to March 2023), a decrease from 11 in the previous year. These included five fatalities which occurred in mainline stations and at the platform-train interface, two passenger fatalities at stations on the London Underground and one fatality from a collision between a member of the public and a tram.” [5] The 8 fatalities in the year are lower than those reported by Holt Schooling. The total number of passenger fatalities in the years 1887 to 1901 was 520 people. The average number of fatalities per annum during that time was close to 35. But the network in the 21st century is much smaller.
“As of August 2024, the UK’s National Rail network is 10,072 miles (16,209 km) in Great Britain and 189 route miles (303 route km) in Northern Ireland. This network includes 20,000 miles of track, 30,000 bridges, tunnels, and viaducts, and around 2,500 stations.” [6]
By 1914, “the country had 23,000 miles of rail track and 4,000 stations, according to industry body Rail Delivery Group.” [7] Assuming the parameters are consistent, this means that the network in 2024 is less than 45% of that serving the country in 1914. If the network were of a similar size to that in 1914, the 8 fatalities in 2022/23 would equate to nearer to 15 fatalities after the turn of the 20th century. It is reasonable to think that, at least as far as fatalities are concerned, the modern rail network is safer than that operating in the early 20th century.
Conclusions
The statistics quoted and reviewed by Holt Schooling, provide an insight into the activities of railway companies at the turn of the 20th century. Passenger numbers were to increase further over the years and hit a peak in 1920 but then dropped to a low point in 1982 before recovering strongly. Only to see a drastic temporary reduction as a result of the pandemic.
Both passenger numbers and accidents are reported differently in the 21st century. However, as much as it is possible to compare figures from times more than a century apart, and as limited as this analysis has been, we can tentatively say that modern railways are comparably well patronised and safer than they were early in the 20th century.
References
- J. Holt. Schooling; Lessons from Railway Statistics; The Railway Magazine, London, July 1903, p20-28.
- https://acrobat.adobe.com/id/urn:aaid:sc:EU:57cdd71b-c52f-4e61-904f-41747a63401c, accessed on 17th August 2024.
- https://dataportal.orr.gov.uk/statistics/usage/passenger-rail-usage, accessed on 17th August 2024.
- https://dataportal.orr.gov.uk/statistics/health-and-safety/rail-safety, accessed on 17th August 2024.
- https://acrobat.adobe.com/id/urn:aaid:sc:EU:c4f6f4fb-bdf4-451b-8449-54a9c3535b95, accessed on 17th August 2024.
- https://www.networkrail.co.uk/who-we-are/about-us, accessed on 17th August 2024.
- https://www.networkrail.co.uk/stories/wwi-and-the-railway, accessed on 17th August 2024.
- https://acrobat.adobe.com/id/urn:aaid:sc:EU:4dbd5c90-5246-4d60-b948-9530c728c4ec, accessed on 17th August 2024.
- The Railway Magazine, London, July 1903, p59.
